JVM metrics monitoring is important when you’re want to know how your JVM-based applications will behave in production at scale. Some main areas you would want to foucus are Garbage collection, Number of threads, JVM memory usage. In this step by step guide we’ll learn how to connect with locally running JVM and JVM running remotely in a Kubernetes cluster as. a docker container.
We’ll use JConsole. JConsole is included in your JDK. Read more about JConsole here.
# change directory to your app directory
cd /APP_DIRECTORY
cd /target

# make sure to have a jar of the app ready

# we'll set up JMX variables and pass those via java command line options

java -jar APP_NAME.jar \
-Dcom.sun.management.jmxremote \
-Dcom.sun.management.jmxremote.port=9010 \
-Djava.net.preferIPv4Stack=true \
-Dcom.sun.management.jmxremote.authenticate=false \
-Dcom.sun.management.jmxremote.ssl=false \
-Djava.rmi.server.hostname=localhost


# In another command line type in jconsole, jconsole is part of the Java JDK. It is GUI tool for the Virtual Machine
#(Java VM) to provide information about the performance and resource consumption of applications running on the # Java platform.
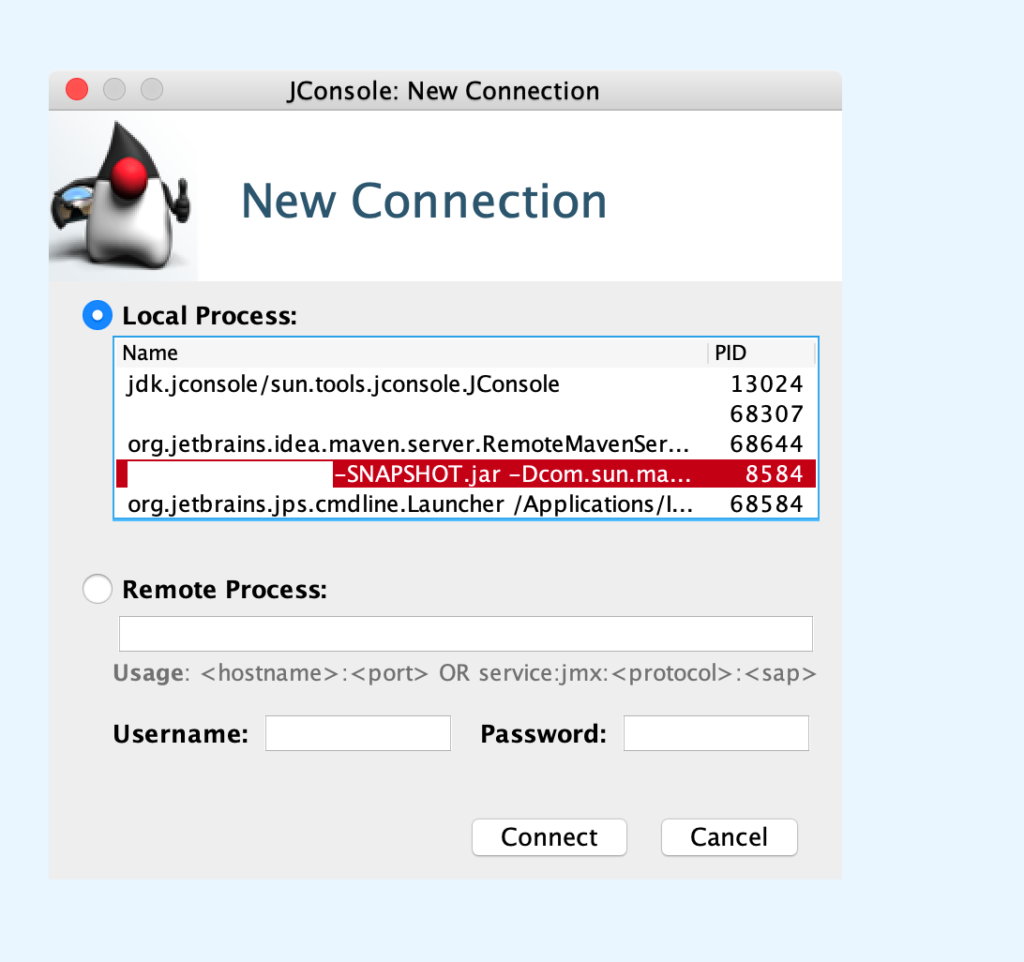
Once you’re running the jar and Jconsole running you’ll see following screen connect to jar of the app
(In the screenshot below name of my app has been redacted)
After connecting you’ll see metrics being colleted.
In the following screen shot you’ll see Memory allocations, threads, beans.

How to connect to a remote JVM deployed in docker container.
We need to set up a password and the access role by providing details in a plain text file. Once this local file is read thecontents are encoded.
Create jmxremote.password file as follows:
monitorRole #YOUR_PASSWORD
controlRole #YOUR_PASSWORD

# change permission of the file so that it is only owner can read and write it.

chmod 600 jmxremote.password


# create jmxremote.access file

monitorRole readonly
controlRole readwrite

# update docker file with following content when you pass in the Java Environment variable in dockerfile

java -Dcom.sun.management.jmxremote \
-Djava.net.preferIPv4Stack=true \
-Djava.rmi.server.hostname=localhost \
-Dcom.sun.management.jmxremote.local.only=false \
-Dcom.sun.management.jmxremote.port=9010 \
-Dcom.sun.management.jmxremote.rmi.port=9010 \
-Dcom.sun.management.jmxremote.authenticate=true \
-Dcom.sun.management.jmxremote.password.file=jmxremote.password \
-Dcom.sun.management.jmxremote.access.file=jmxremote.access \
-Dcom.sun.management.jmxremote.ssl=false \
-jar query-app-1.0.74-SNAPSHOT.jar

# now you can run port forwarding on the required port 9010
$ kubectl port-forward service/APP_SERVICE 9010:9010
Now using same jConsole screen use remote connection with password you used in the set up steps.

Sucess! In this post we covered how to connect to a JVM to get JVM metrics and also learned thow to securely conenct to JVM remotely. Next step would be to analyze memory usage, garbage collection and therad activity when the app is working under different workloads.